Blogs
- All
4 Mins Read | Feb 12th 2025
What is Gartley Pattern?
In trading, tools and strategies count the most. One popular technique is the Gartley Pattern. Whether you are trading stocks, commodities, or diving into the depths of Gartley pattern in Forex trading, this pattern can be a game-changer for you. Continue reading to know more.
Introduction of Gartley Pattern
The Gartley Pattern, named after H.M. Gartley who introduced it in his book ‘Profits in the Stock Market’ in 1935, can be considered as a powerful harmonic chart pattern that traders can use to identify potential reversals in the market. This pattern resembles an ‘M’ or ‘W’, depending on whether it is forming a potential bullish or bearish pattern.
Bullish Gartley Pattern
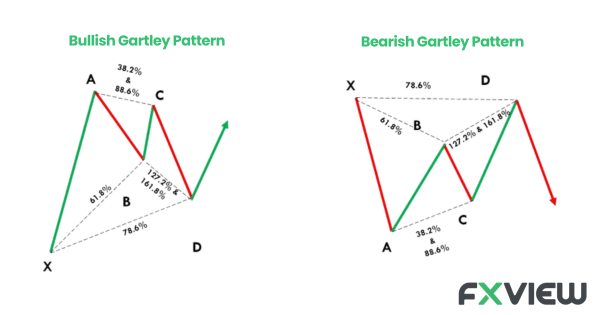
A potential bullish Gartley pattern may emerge when the market is in a possible downtrend. This pattern appears when prices match certain Fibonacci levels in a row. Here is what the bullish pattern looks like:
The initial leg (X to A) is followed by a retracement (A to B).
Then, there is a partial rise (B to C).
Finally, it is followed by a decline (C to D), from where a potential bullish reversal is expected.
Bullish Gartley Pattern Example
Imagine a scenario where the EUR/USD pair is in a downtrend. You spot a potential bullish Gartley pattern forming. At point D, where the pattern completes, you see a strong bullish candlestick pattern forming on the daily chart. This is your signal that a reversal might be in the works. You may enter a long position at the opening price of the next candle, set your stop-loss just below point D, and your profit targets at the 38.2% and 61.8% levels of the CD leg.
Bearish Gartley Pattern
Conversely, a potential bearish Gartley pattern can emerge when the market is in an uptrend. Just like its bullish counterpart, this pattern consists of four legs (X to A, A to B, B to C, and C to D), but forms a ‘M’ shape, signalling a potential bearish reversal.
Principles of Gartley Pattern
To recognize a valid Gartley pattern in trading, certain rules must be met:
The AB leg should be a 61.8% retracement of the XA leg.
The BC leg should be a 38.2% to 88.6% retracement of the AB leg.
The CD leg should be a 78.6% retracement of the XA leg.
The CD leg should also be an extension of 127% to 161.8% of the BC leg.
Following these rules is important to make sure you’re really seeing a Gartley pattern, not just a random shape.
Using Gartley Pattern for Trading
Trading this pattern effectively involves a few crucial steps:
- Identify the Pattern: First and foremost, learn to spot the Gartley pattern on your chart. This might involve some practice initially.
- Wait for Indication: Don’t jump the gun. Wait until the pattern is completed and price action indicates a reversal at point D.
- Set Stop-Loss Orders: Using Stop-Loss Order may assist with the limitation of potential losses.
- Determine Profit Targets: Common targets are set at the 38.2% and 61.8% retracement levels of the CD leg.
- Manage Risk: You may consider using only a small part of your trading capital.
Key Takeaways
To see why the gartley pattern matters, remember:
- Traders have liked it since the 1930s, showing its value.
- Strict rules make it accurate and reduce false signals.
- Works in Forex, stocks, and commodities.
- A clear map for risk.
- Important in smart trading plans.
- Like sailing, trading needs skill and tools..
So, when you’re scanning charts, keep an eye out for this pattern – it could be your ticket to desirable trades.
Disclaimer: The information contained in this article is provided for educational and informational purposes only and it is not intended to be, nor does it constitute financial, investment or trading advice. You should not make any financial, investment or trading decision based on the information provided in this article without performing your own research or seeking advice from an independent advisor.
Related Posts
View All Market Analysis
Fundamental Analysis
Navigating financial markets well, demands sharp thinking. Understanding fundamentals can be important for traders, especially in forex where currencies react to global events, making them highly volatile. In this guide, we’ll explore why fundamental analysis matters in forex, break down how it works, and compare it to technical analysis.
Read More4 Mins Read | Feb 12th 2025


Related Posts
Feb 12th 2025
Fundamental Analysis
Feb 12th 2025
How to use the Crab Chart Pattern in Trading?
Feb 12th 2025
Start Forex Trading: 8 Essential Steps
Feb 12th 2025
9 Popular Economic Indicators in Forex
Feb 12th 2025
Market Sentiment Indicators- An Ultimate Guide!
Feb 12th 2025
What is Sentiment Analysis in Forex Trading?
Feb 12th 2025
9 Must-Know Harmonic Patterns in Forex
Mar 13th 2025
Is The Ukraine Conflict Affecting CFDs and Markets?
May 20th 2025
Will the RBA Cut Rates by 25 Bps on May 20?
May 20th 2025
Will the RBA Cut Rates by 25 Bps on May 20?
Jun 19th 2025
Oil Price Movements Amid Israel-Iran Tensions
Jun 19th 2025
Oil Price Movements Amid Israel-Iran Tensions
Feb 12th 2025
What is a Swap Rate? 5 Things You Need to Know
Feb 12th 2025
Understand CFD Trading: A Comprehensive Guide!
Feb 12th 2025
How to use the Butterfly pattern in Trading?
Feb 12th 2025
How to use the Bat Pattern in Trading?
Feb 12th 2025
9 Must-Know Harmonic Patterns in Forex
Feb 12th 2025
Forex Scalping Basics


Ready to trade?
Open an account in less than 5 minutes. Start trading your way.