Blogs
- All
4 Mins Read | Feb 12th 2025
What is Bollinger Band in forex- A Complete Guide
Bollinger Bands in Forex are a powerful tool for analyzing market movements in the complex world of forex trading. Have you ever wondered how traders might use such tools to enhance their decision-making in a market full of uncertainties? This method, incorporating Bollinger Bands in forex trading, is crucial in a forex trader's toolbox, helping to assess volatility and identify price patterns more effectively.
Understanding Bollinger Band in Forex
In the 1980s, John Bollinger created Bollinger Bands. It is a type of technical indicator that appears on your forex chart as three lines. Let's analyze the meaning of each line:
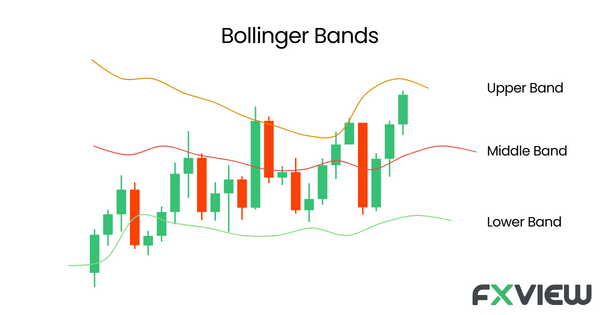
- Upper Band: One standard deviation above the middle band where this line is located. The top band can be used as a form of "high tide mark" for pricing, as standard deviation may be an indicator of volatility. The volatility may increase as the distance between the upper and middle bands widens.
- Middle Band: The middle band is where the Bollinger Band could be considered strongest. It usually represents the average price movement over a selected period (e.g., 20 days) as a simple moving average (SMA). Take it as the price action's center line.
- Lower Band: Located two standard deviations below the middle band, the lower band reflects in the upper band. As a "low tide mark," this may indicate possible areas of lower price activity.
How to Use Bollinger Bands in Forex Trading
After learning about the Bollinger Band's construction, let's look at how you may apply it to your Bollinger Bands in forex strategy. Here are some other considerations:
- Volatility Squeeze and Breakout: A period of low volatility can be seen when the upper and lower bands contract. There are times when this "squeeze" could be followed by a strong price breakout in one direction or the other, which could indicate a trend ongoing or flips.
- Overbought and Oversold Conditions: Overbought conditions may be indicated if price movement is constantly near the higher Bollinger Band. On the other hand, prices that are close to the lower band may indicate an oversold situation. But keep in mind that these are simply indications, not guarantees.
- Price Channel and Support/Resistance: A dynamic price channel can also be created by the Bollinger Band in forex. These bands may be observed by prices as levels of support and resistance, and they could bounce off before the trend continues.
A Case Study: Bollinger Bands Forex Strategy in Action
Assume you are looking at the EUR/USD chart and have combined a 20-day SMA with the Bollinger Band. This is how things could proceed:
- Scenario 1: Breakout - The Bollinger Bands in forex have been contracting recently, indicating a low-volatility phase. Price rises up and breaks above the upper Bollinger Band with decisive force.
- In scenario 2, there is a compression of the Bollinger Bands, indicating a potential breakout. The price action, however, only makes a short touch with the top Bollinger Band before correcting and moving back toward the middle band. It is important to use Bollinger Bands in forex together with other technical indicators for confirmation, as this could be a false signal.
Above and Beyond: Bollinger Band Variations and Additional Tips
There is room for change, even though the traditional 20-day SMA and two standard deviations are a decent place to start. Here are some other points to consider:
- Bollinger Band Width: Volatility can be determined by measuring the distance between the upper and lower bands. Wider volatility is indicated by a larger band, and stable markets are suggested by a narrower band.
- Bollinger Band Percentage Bands: Some traders can choose a percentage bandwidth (e.g., Bollinger Bands with 2% above and below the SMA) to standard deviations. Comparing volatility across various currency pairs can be applied.
- Bollinger Band with Other Indicators: Use more than just Bollinger Bands in forex. For an enhanced trading strategy, think about combining them with more technical indicators like the Stochastic Oscillator or Relative Strength Index (RSI).
Bollinger Bands & Risk Management
Bollinger Band indicators are utilised to show an asset's relative price performance as well as the volatility of the market. This data can be utilised as part of an overall risk management strategy. In short, using the data from Bollinger Bands in forex, you may utilise automatic buy and sell orders along with take-profit and stop-loss limitations.
Key Takeaways:
- Bollinger Bands in forex market can be a valuable technical indicator that may help visualize volatility.
- A middle band (SMA), an upper band (two standard deviations above), and a lower band (two standard deviations below) makes up the Bollinger Band.
- Potential breakouts may be indicated by Bollinger Band squeezes, and overbought or oversold conditions may be indicated by price movement close to the bands.
Conclusion: Getting knowledge of Bollinger Bands in forex trading can assist in making trading decisions. You may gain greater understanding of market dynamics by using these various indicators in your research. Why then wait? Explore Bollinger Bands in forex and test it in your trading strategy.
Disclaimer: The information in this article is provided for educational and informational purposes only and is not intended to be, nor does it constitute financial, investment, or trading advice. You should not make any financial, investment, or trading decisions based on the information provided in this article without performing your research or seeking advice from an independent advisor.
Related Posts
View All Strategies & Tools
What is Algorithmic Trading: A Detailed Guide
What is Algorithmic Trading? Algorithmic trading, also known as algo or automated trading, has gained popularity in recent years due to advancements in technology and easier access to trading platforms. This...
Read More4 Mins Read | Oct 18th 2024


Related Posts
Oct 18th 2024
What is Algorithmic Trading: A Detailed Guide
Feb 12th 2025
Support and Resistance Indicator- A Beginner's Guide
Feb 12th 2025
Carry Trade Explained: A Simple Strategy Guide
Feb 12th 2025
9 Popular Economic Indicators in Forex
Feb 12th 2025
How to create a trading plan: A Comprehensive Guide!
Feb 12th 2025
Why is Reviewing Trading Plan Necessary?
Feb 13th 2025
AI Trading in 2025: A Breakthrough for Traders
May 20th 2025
Will the RBA Cut Rates by 25 Bps on May 20?
May 20th 2025
Will the RBA Cut Rates by 25 Bps on May 20?


Ready to trade?
Open an account in less than 5 minutes. Start trading your way.